Data clustering – initial views
I have started to look at clustering the location readings into important places. To give me a feel of what the data looks like, I have visualised all of the locations.
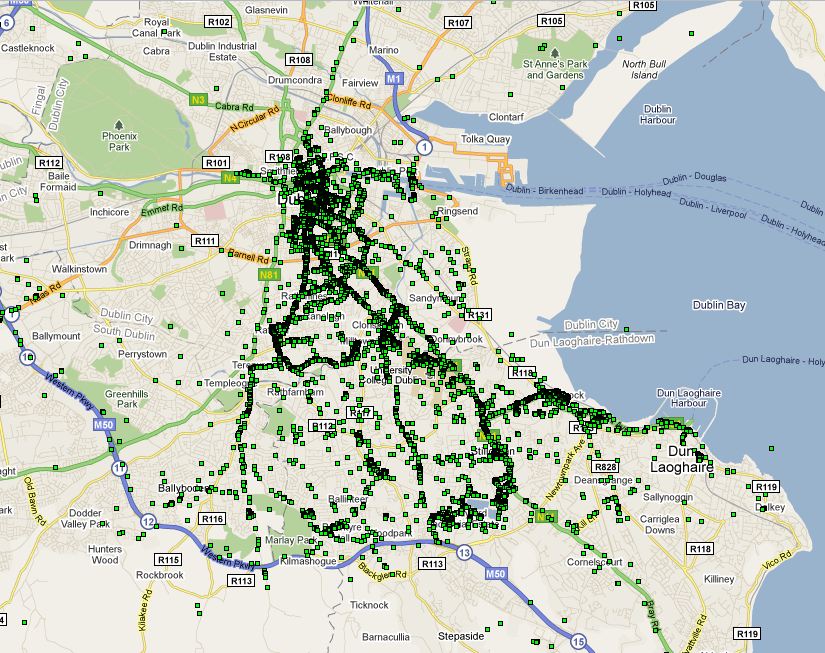
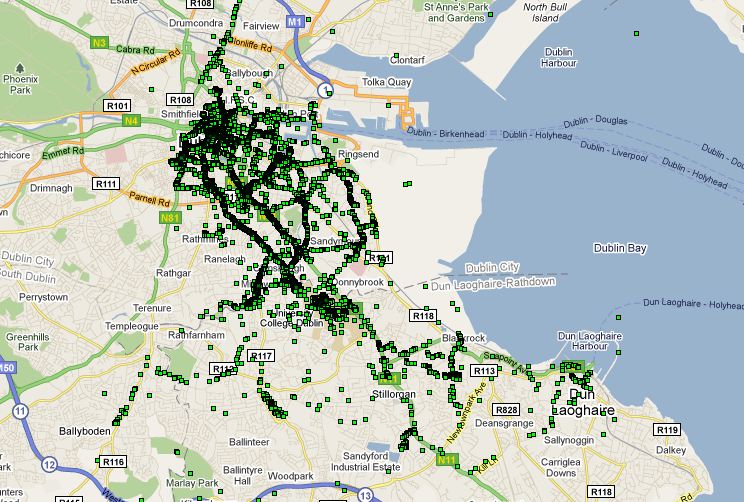
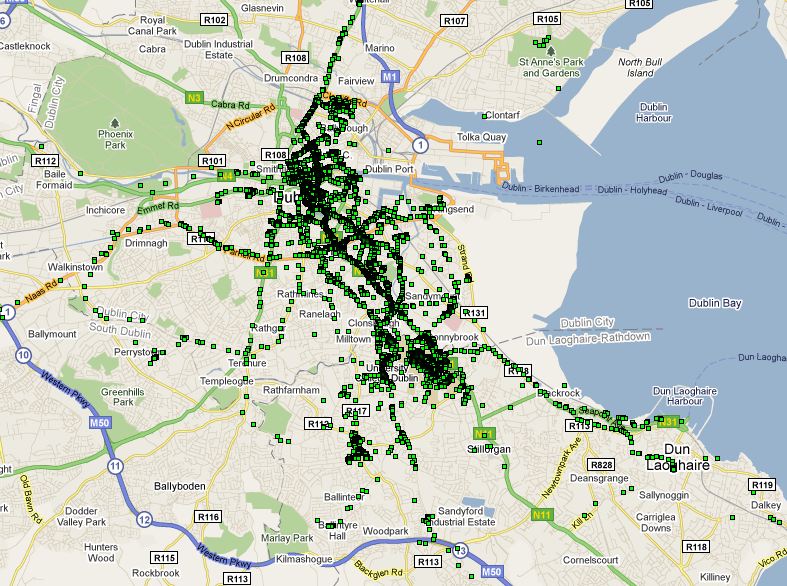
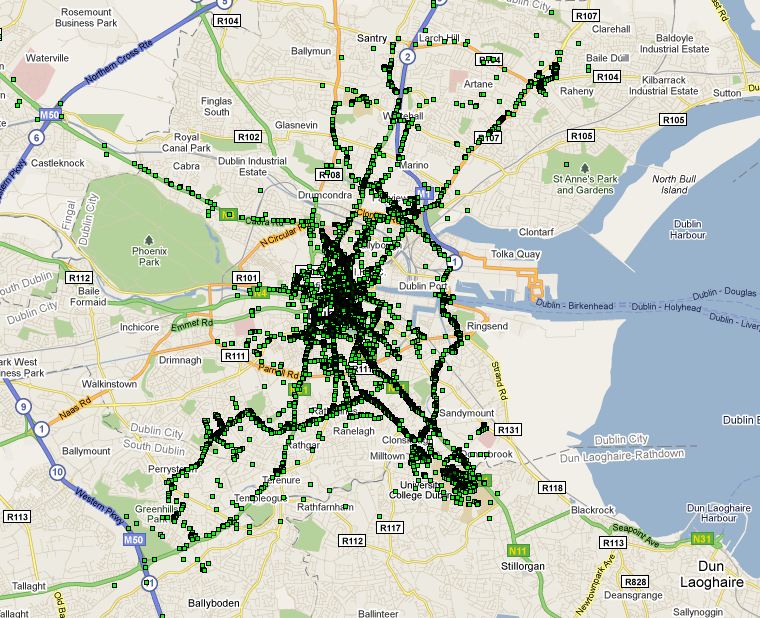
Because of the limitations of the browser, it was not possible to visualise all ~40,000 points in the dataset, so it is split into 4 lots of ~10,000. These images are only intended to give a rough idea of how the data is spread out.
My initial thoughts are that there is too much density, and therefore the clustering algorithm has to be highly selective when choosing a place.
Categories: Uncategorized
It looks similar to Geolife, with points along the main roads which presumably don’t represent a real location. Depending on the algorithm chosen, many isolated points may be disregarded, but I think it looks ok.
Alright, coderemexico, let’s see what you’ve got. New to the scene? Always looking for something fresh. Check them out: coderemexico
361betlogin makes it super simple to get in the game. Quick and easy access to all your favorite bets. No fuss, just fun! 361betlogin